For the month of Feb I have been recording the breakout trades on three currency pairs, the GBP/USD, GBP/JPY and EUR/JPY. The EUR/JPY has gone from being the most consistant to the worst performer for the month.
If I look at the monthly candle for the EUR/JPY it is still an inside candle well within the January range.

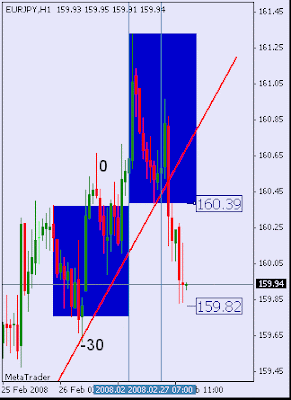
EUR/JPY 1 hr Chart
Click to EnlargeThe Blue shading is the Asian Pacific trading time and the candles above and below are the breakout trades. Whilst I have tried to aim for 60 pips a day, some days the market only ran 30 to 50 pips and I have locked in profits or closed out at break even.
Thats fine for traders who monitor their trades as I do, but for those who place the orders and leave them for better or worse, the figures would differ by 200 pips for the month. The net result would be 290 pips up for the month to date and for those who can monitor trades 490 for the month.
Many days the market has run more than the required 60 pips but that has not been taken into consideration for the above calculations.
There were four outright losing days with two of those days producing losses on both the long and short entries. There were 9 days where the trades produced the full 60 pip profits.
On a number of days the market stopped just short of the 60 pip target and lesser profits were recorded. Some days there were more than 2 trades as price broke through then retraced and broke out a second time.
The daily average for this pair was about 28 pips per day profit. Thats not great but there are many traders out there who would love to make 20 pips per day.

GBP/USD
On this chart I have recorded the maximum run for the day but those figures are not included in the calculation. The daily target on this pair is 50 pips per day with a 30 pip stop loss. For those who trade cable you will know how volatile this pair can be at the open of the European session, yet the pair has performed well on the breakout strategy.
There were only two outright losing days and many days with moves in excess of 200 pips. The 50 pip target was achieved on 14 of the trading days.
The daily average for this pair 33 pips per day.

Gbp/Jpy
One of the most volatile trading pairs, yet the star performer for the month achieving the 70 pip target on 15 occasions. There was only one outright losing day, with 4 losses recorded for the month.
Total profits for the month Gbp/Jpy 1110 pips for an average of 62 pips profit per day.
I have ignored the overnight rule of 80 to 100 pips as sometimes after a large overnight move the trade still produces the required profit and I am not in the market. I have also instituted a mandatory 30 pip stop as it makes no sense to risk the same amount that you stand to lose.
The total profits for Feb for all three pairs 2200 pips or 122 pips per day, must make this simple 10 min a day setup, worth adding to any Forex Trading arsenal.
It is obvious that market conditions change and a pair that performed well previously might not perform as well in the future. There will also be drawdowns and sometimes two losses on a single currency pair on a trading day. This should be allowed for in any trading strategy.
It is only through consistency and good equity management principals that any trading strategy can either prove itself or fail. If we are going to employ a particular strategey then all the trades must be taken, it does not help to do the occasional one as that will inevitably be the losing trade, which will cause us to discard the strategy and go in search of a new one.
I have been using the strategy as part of my trading routine for almost 4 months now and it certainly gets my vote for its simplicity and results.
It does differ from the Power Break strategy in that it involves three currency pairs rather than the two Eur/Jpy and Gbp/Usd employed by the power break system. The Power break system I understand uses a mandatory 40 pip profit limit and 40 pip stop loss with overnight moves larger than 80 pips resulting in a no trade. Other than that I think the methodology is similar.


